Every floor plate,
a line item.

Mesa underwrites the complexity of mixed-use so investorssee exactly where the yield lives inside the vertical.
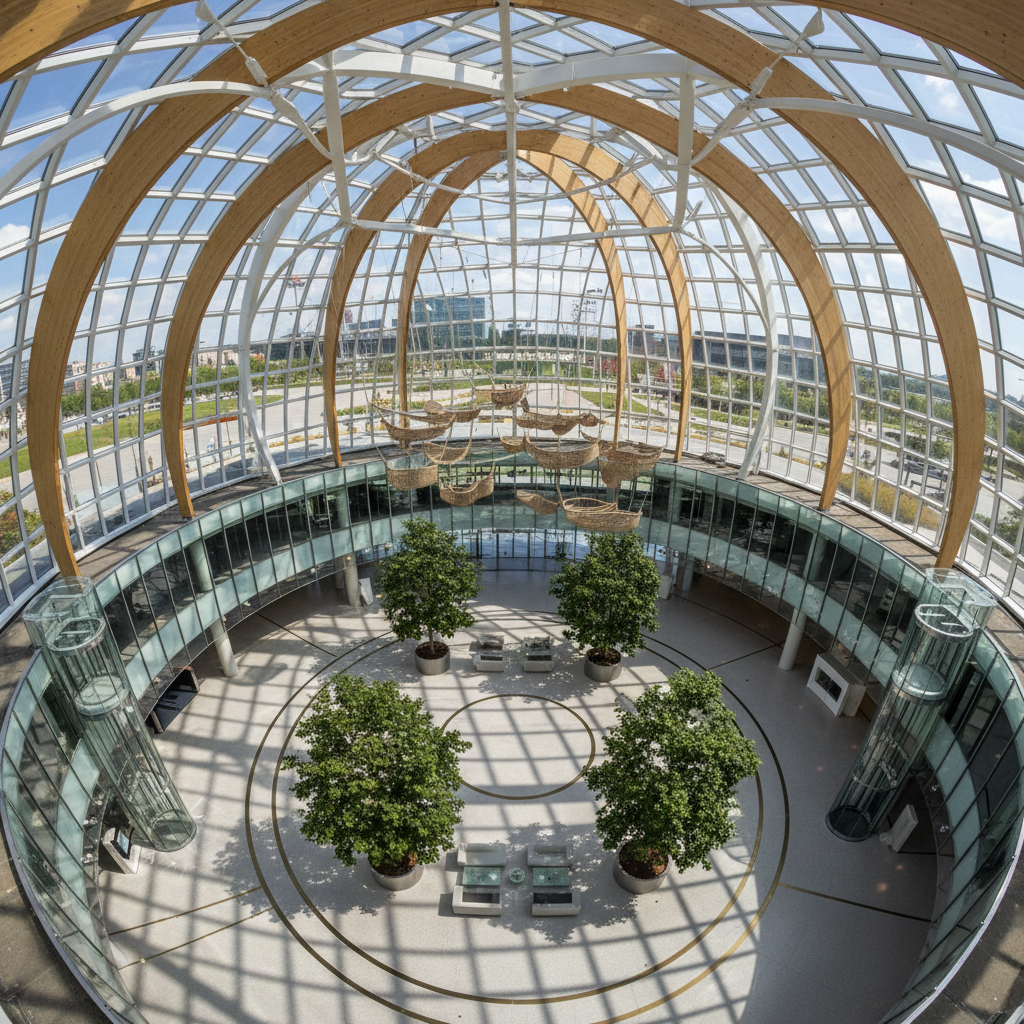
Lobby atrium shot from above showing grand architectural scale
Retail NNN: 6.2% cap
Retail corner at dusk with warm interior glow through glass facade
Retail Occupancy: 97.4%
Residential balcony with city-light bokeh at twilight
Residential: 94% pre-leased
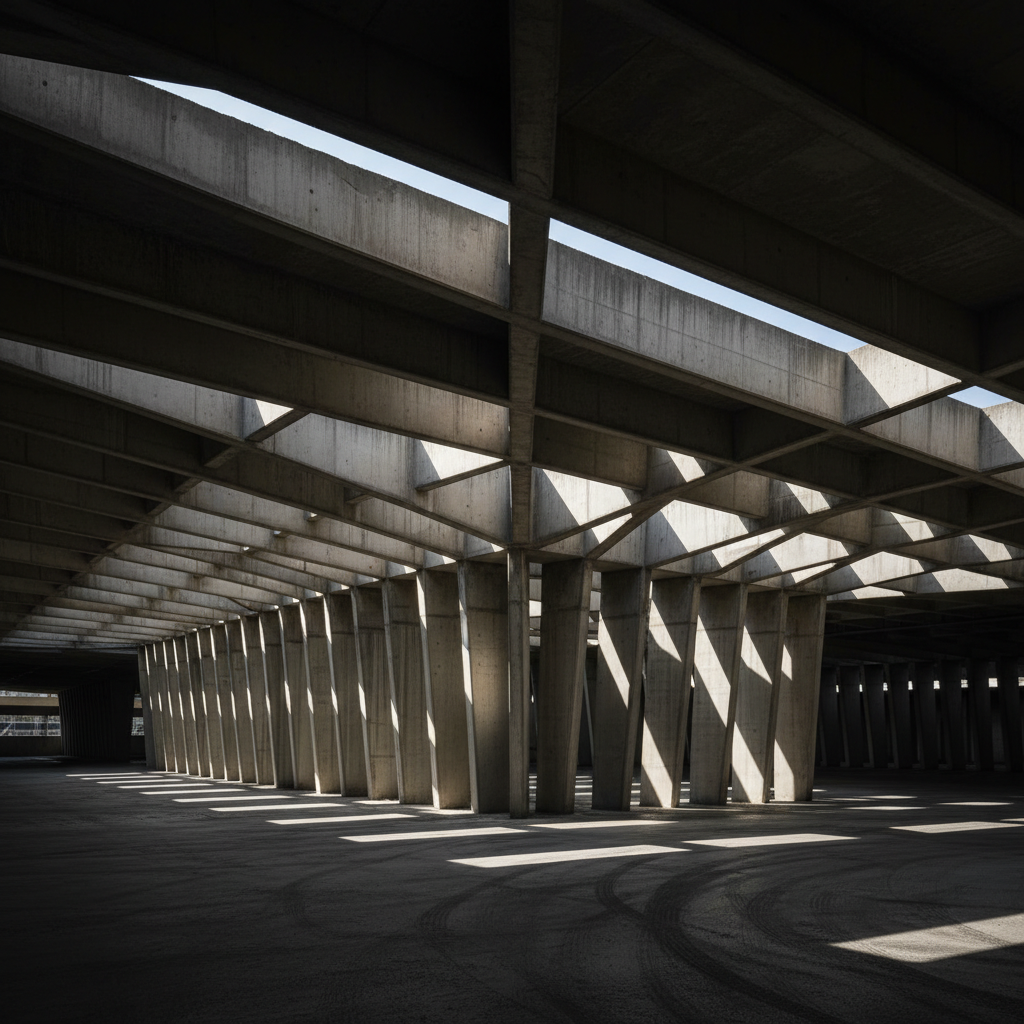
Parking structure geometric concrete ribs with shadow play
Structured Parking: $180/mo
Rooftop amenity deck at sunrise overlooking city skyline
Amenity Premium: +$280/unit
Leasing office mid-handshake professional real estate transaction
Office NNN: 5.8% cap
Transit platform with motion blur passengers commuting
Transit Score: 92 / Walk: 88
Courtyard fountain caught mid-arc in luxury residential complex
Blended Cap: 5.9%
Explore

Not one investment.
Five interlocking ones.

Select an asset class to reveal per-floor yield assumptions, tenant mix, and repositioning optionality.
Modern retail ground floor with warm interior lighting and glass storefronts
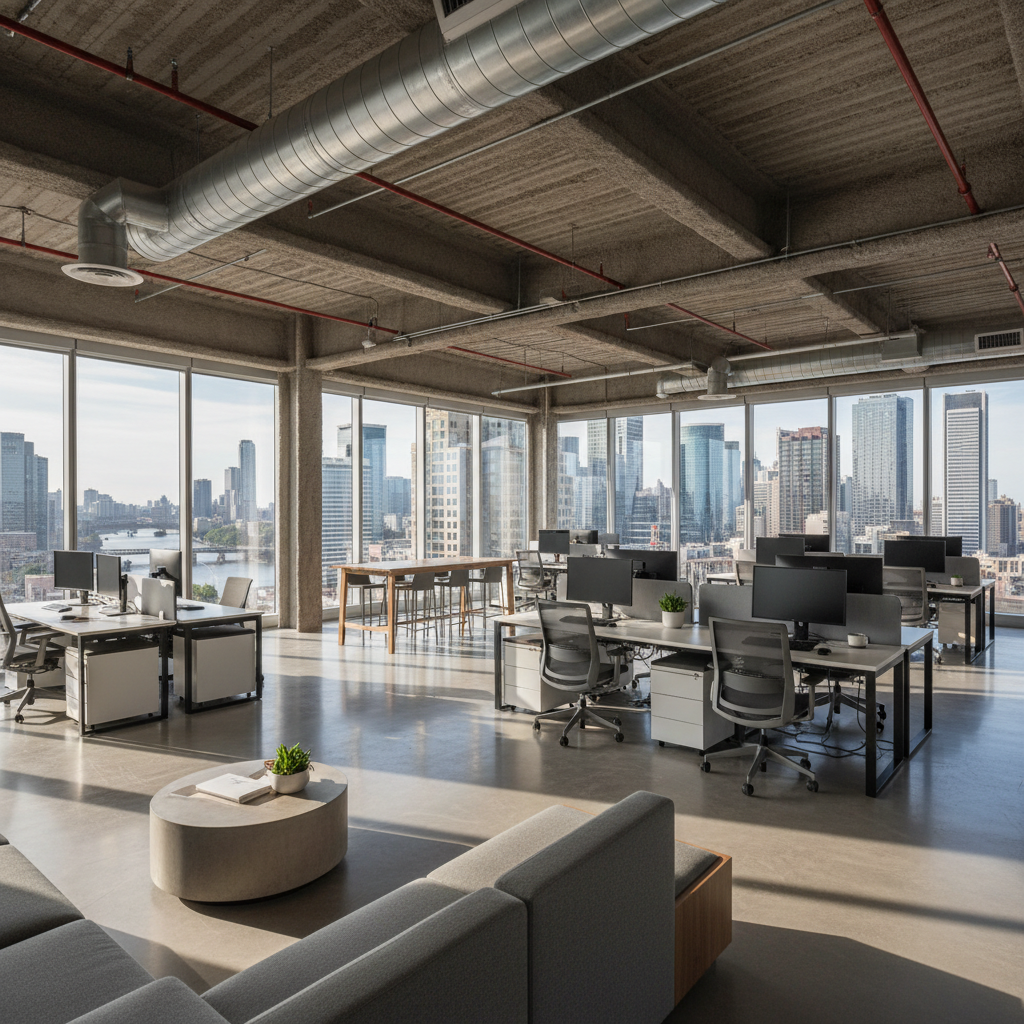
Open plan Class-A office space with city views and exposed ceiling design
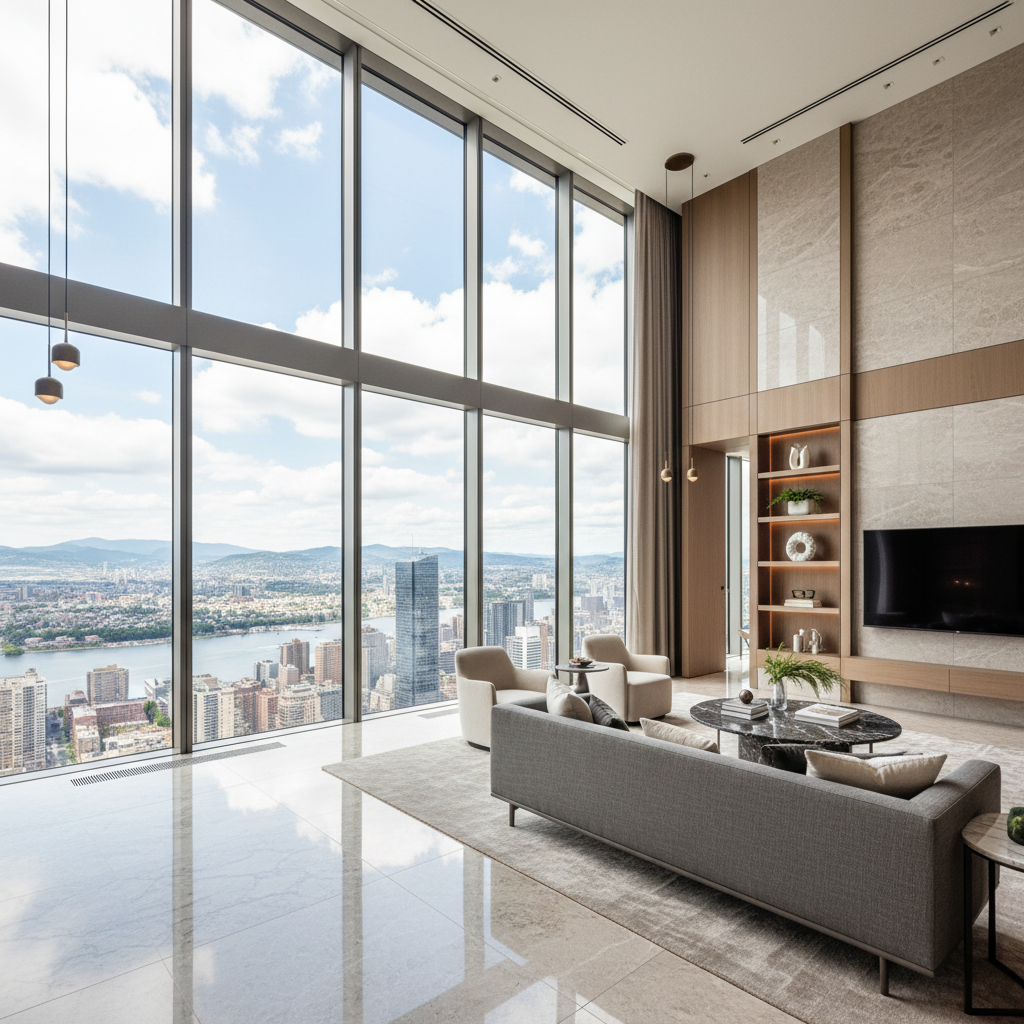
Luxury residential tower upper floors with panoramic city views and premium finishes
Retail · Floors 1–2
6.2%
Cap Rate
$48 / SF
Rent / SF
97.4%
Occupancy
$2.1M
Annual NOI

Ground-level NNN retail anchored by a national grocer, with inline specialty tenants on the second floor. Below-market rents on 3 of 7 units create mark-to-market upside at lease rollover in 2027.

Mark-to-market upside: +$340K NOI at 2027 rollover

Tenant Mix

National Grocer (anchor)F&B OperatorMedical Urgent CareBoutique Fitness3 Inline Specialty

Where most see a building,
we read a balance sheet.

5–7
Distinct yield layers per parcel

We model each asset class on its own income statement before consolidating. A retail podium with a struggling anchor doesn't contaminate the residential tower's yield story — we see the seams.

8 wks
Avg. Engagement
$2.4B
Deals Closed
±1.2%
Client IRR Accuracy

The Cortez Block.
Floor by floor.

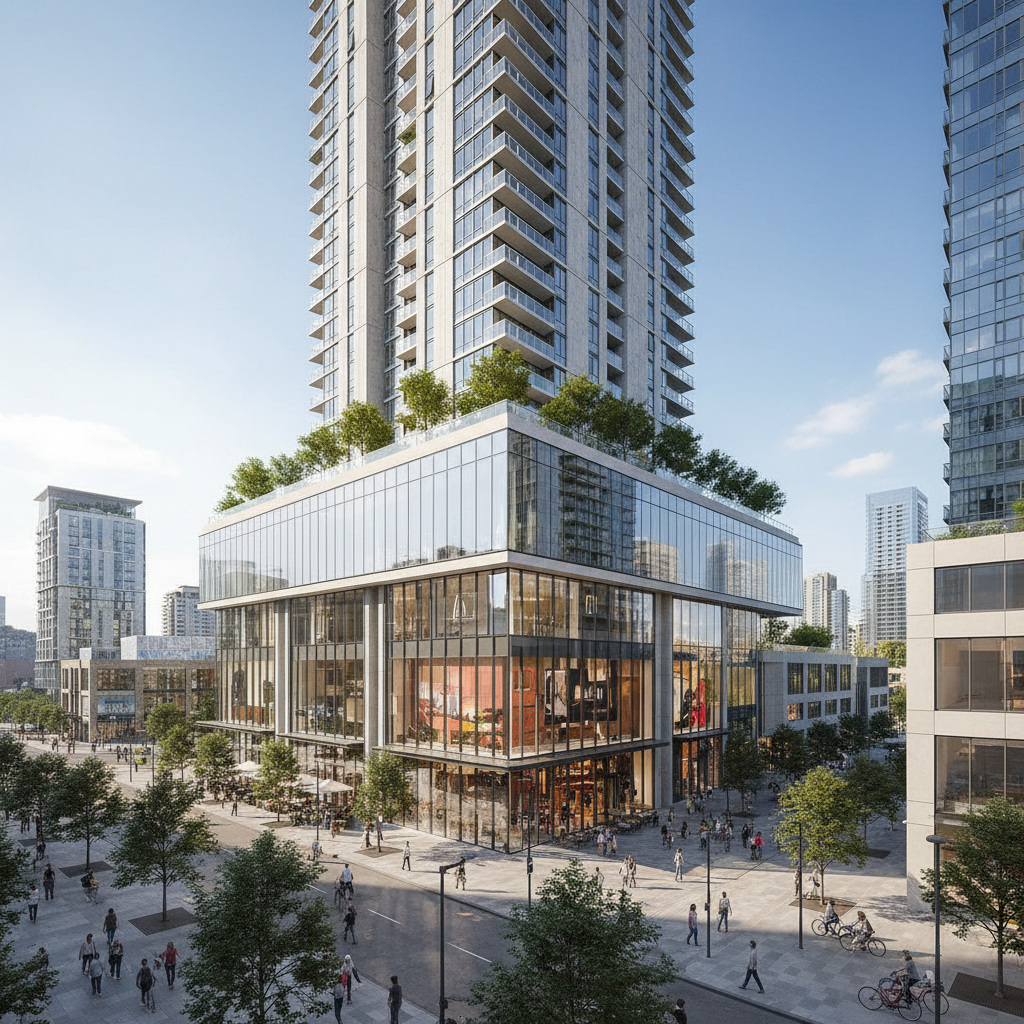
A 310,000 SF mixed-use parcel in a transit-adjacent urban core. Mesa was engaged to validate the developer's pro forma before a $94M equity raise — and found three layers of mispricing the original model missed.
$11.89M
Stabilized NOI
5.9%
Blended Cap Rate
$94M
Equity Raise
Mixed-use tower showing retail podium below residential floors in urban setting
B1–B2 · Structured Parking1–2 · Retail NNN3 · Civic / Podium4–9 · Office Class-A10–25 · ResidentialRoof · Amenity Deck
Floors
Asset Class
Rent / SF
NOI
B1–B2
Structured Parking
84,000 SF
$180 / space / mo
$680K
1–2
Retail NNN
22,400 SF
$48 / SF
$2.1M
3
Civic / Podium
8,200 SF
Ground lease
$210K
4–9
Office Class-A
96,000 SF
$62 / SF
$3.7M
10–25
Residential
312 units
$3.80 / SF
$5.2M
Roof
Amenity Deck
4,800 SF
Resident amenity
+$87K
Total
All Classes
Blended 5.9%
$11.89M

Mesa Finding: $1.9M of mispriced NOI

The developer's pro forma missed the parking lease repricing event (2031), the retail mark-to-market on 3 below-market leases, and the residential 2BR unit mix premium. Mesa's recast increased projected equity IRR from 14.2% to 17.6%.

Assess Your Mixed-Use
Opportunity.

Five questions. Each one surfaces an insight about your deal. Takes less than three minutes.

Step 1 of 520% complete

What stage is your project?

Select the phase that best describes where you are today.

Mesa Insight · Repositioning plays with three or more asset classes see 18% wider IRR variance than single-class assets — the seams between uses are where value hides.

The Mixed-Use Underwriting Checklist

The 47-point checklist Mesa uses on every engagement. Free one-pager — enter your email and download instantly.

Why Mesa

$2.4BCapital advised since 2018
61Mixed-use engagements closed
±1.2%Average IRR forecast accuracy
8 wksAvg. engagement to close